Rad & Dot Net - Digital Warrior

Assorted ramblings (and vents!!) from a techie on the sunny shores of Kenya, East Africa

Tuesday, May 17, 2005

AfricaDotNet

The AfricaDotNet site http://www.africadotnet.org is back up again after a small snafu.

Wednesday, May 11, 2005

Charting

Like I said before, graphing in .NET is much tricker than it sounds. You need to:
  • Find out the largerst and smallest values in order to draw the axes
  • Adjust your thinking from a 0,0 in the bottom left to one on the top left
  • Plot the axes
  • Cater for positive and negative values while doing this

  • Plot the axis labels
  • Establish what is being plotted against what
  • Calculate the points to draw the lines/rectangles for the charts
  • Draw the lines and graphs
  • Where appropriate, convert the lines to splines
  • Measure the width of the strings labelig the axis (if text or date) and rotate to fit on the axes
  • Plot the major and minor gridlines
  • Render the data points
  • Render the labels

So far so good. I've cracked then all apart from rendering the axis labels. Here is a very rough sample or my preliminary work

Here is another sample with spaces between the bars

Here is a version with overlapping bars. Notice i've implemented transparency

Tuesday, May 10, 2005

Graphing GDI+

A project i'm working on requires quite a bit of charting. Which is no biggie. There are lots of free solutions. However I want to do some rather exotic things with the charts including
1) Multiple axes
2) More than one chart type superimposed on another e.g. bar on a line on an area
3) Render to web and screen
4) Support transparency
5) Support simple interactivity i.e. drill down
6) Output SVG, PNG and JPEG

Of all the existing one most can be eliminated because
- They don't do what I want esp 1,3 and 5
- Licencing issues (Excel, OWC). If you use this method on the web, every connecting client should have an office licence. Yikes!
- Cost
- Some problem or the other (ZedChart, NGraph, ChartDirector, etc)

The closest one i've found is- Dundas Charts. But the price has to be seen to be believed.

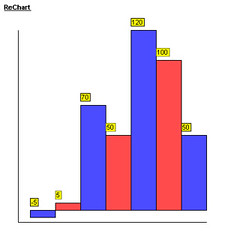
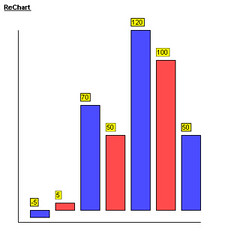
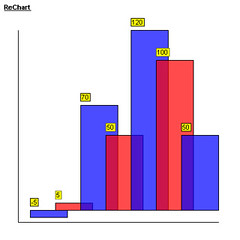
So i'm doing it myself with GDI+.

It's actually easier than I thought -- .NET support for drawing is simply first rate. The only annoying thing is that the origin, 0,0 is the top left corner. So the code to render the bars, lines, etc needs to factor this in when plotting the co-ordinates. But it's running like poetry.

So far so good - i've got bar charts running so next is the line, scattergram and pie

Drawing graphs is much trickier than it sounds, especially the approach i have taken -- doing it in layers. More on that later

Monday, May 09, 2005

Bonjour

Apple have some spectacular looking technology that allows you to network without running after IP addresses http://developer.apple.com/networking/bonjour/index.html

Tres cool!