Charting
Like I said before, graphing in .NET is much tricker than it sounds. You need to:
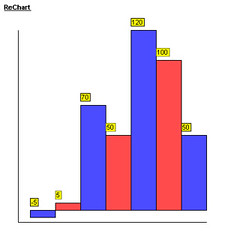
So far so good. I've cracked then all apart from rendering the axis labels. Here is a very rough sample or my preliminary work
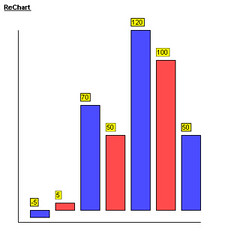
Here is another sample with spaces between the bars
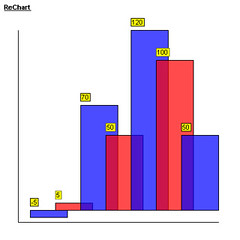
Here is a version with overlapping bars. Notice i've implemented transparency
- Find out the largerst and smallest values in order to draw the axes
- Adjust your thinking from a 0,0 in the bottom left to one on the top left
- Plot the axes
- Cater for positive and negative values while doing this
- Plot the axis labels
- Establish what is being plotted against what
- Calculate the points to draw the lines/rectangles for the charts
- Draw the lines and graphs
- Where appropriate, convert the lines to splines
- Measure the width of the strings labelig the axis (if text or date) and rotate to fit on the axes
- Plot the major and minor gridlines
- Render the data points
- Render the labels
So far so good. I've cracked then all apart from rendering the axis labels. Here is a very rough sample or my preliminary work
Here is another sample with spaces between the bars
Here is a version with overlapping bars. Notice i've implemented transparency
posted by M @ 4:48 PM
![]()
![]()


0 Comments:
Post a Comment
<< Home